Nobody rings a bell at the bottom. I do not know where it is. I am not sure anyone does, and I have learned to be careful around people who
 ‌​‍‎‏ ‌​‍‎‏ ‌​‍‎‏ ‌​‍‎‏ ‌​‍‎‏ ‌​‍‎‏ ‌​‍‎‏ ‌​‍‎‏ ‌​‍‎‏ ‌​‍‎‏

bronsonjob.com

Monthly Market Report · August 2026

August 2026 · Greater Vancouver & Fraser Valley

August 2026: what the early evidence of a turn actually looks like, and where it is starting to show up.

Issue 04 · September 2026 · 10 min read

Line drawing of the Fort Langley Community Hall, the Fraser Valley fields, and Golden Ears beyond

Hi there,

Nobody rings a bell at the bottom. I do not know where it is. I am not sure anyone does, and I have learned to be careful around people who say they do.

What I can do is watch for the things that have tended to show up before a turn. Not a forecast, just a pattern. And tell you plainly when I see one.

Last month I saw one. It showed up on one side of the river and not the other, and this letter is about what it was, what it was not, and what I would do about it.


The number this month

941

Fraser Valley home sales in August, up 1.1% from a year ago, only the second annual gain since the start of 2025, and it arrived while inventory fell.


·

Vancouver Island bottomed in January 2023. Nothing marked the month. Six months later it was up 8%.

·

Where prices sit versus the 2022 peak

Fraser Valley $869,900, down 27%; Greater Vancouver $1,081,900, down 14%

A full bar would be the spring-2022 peak. Both boards eased again in August and remain well short of it, the Fraser Valley much the further of the two.

August 2026 by the numbers

Greater Vancouver sales

1,869

4.6% vs a year ago

Fraser Valley benchmark

$869,900

7% year-over-year

Greater Vancouver benchmark

$1,081,900

5.6% year-over-year

Fraser Valley active listings

9,787

6.3% year-over-year

·  ·  ·

The numbers

The Fraser Valley did something it has not done in a year

Sales rose. 941 homes changed hands in August, 1.1% more than in August 2025, and the board notes it is only the second year-over-year gain since the beginning of 2025. At the same time active inventory fell 6.3% to 9,787. Rising sales alongside falling inventory is the combination that usually precedes a firmer market, and it is the second time both have been true this year: April recorded a 7.2% sales gain against a 2.3% inventory decline, and it did not hold. It is also a 1.1% gain against a weak base, in a month when sales fell 13.6% from July, and it is a figure for all property types. Inside the three main ones the board reports separately, sales did not rise: detached was exactly flat at 332, townhouses fell 2.0% to 244, and apartments fell 7.5% to 234. The annual gain came from everything else the board counts, which is duplexes, manufactured homes, acreage and land. Inventory, by contrast, fell harder in those three types than in the total: detached down 12.9%, townhouses 11.3%, apartments 15.4%. Board chair Ishaq Ismail described the standoff behind it: "Some buyers are seeing an opportunity to negotiate below asking price, while sellers who need to sell are more likely to accept lower offers."

Greater Vancouver did not

Sales of 1,869 were down 4.6% from August 2025 and 20.7% below the 10-year seasonal average. Inventory of 15,798 fell 2.7% year-over-year but remains 26.2% above the long-term norm, and new listings of 4,100 came in 3% below last August. Chief economist Andrew Lis connected the two sides: "Inventory levels have receded from their 2025 heights, and paired with slower-than-usual sales, this has caused prices to drift downwards across all market segments." Sales against active listings works out near 12%, which is the level the board itself treats as the boundary of a buyer's market.

Prices by home type, Fraser Valley

All three eased again, and apartments continued to fall fastest year-over-year. Detached homes ended August at a benchmark of $1,319,600, down 1.2% on the month and 8.4% on the year. Townhomes were $750,600, down 0.9% and 7.1%. Apartments were $466,100, down 0.7% and 8.9%. Detached and condo listings took an average of 45 days to sell; townhomes took 37. Greater Vancouver's figures by home type are not in this report. I could not read the board's own release this month, and I would rather leave them out than quote them second-hand.

More detail, including inventory, days on market, and the regional breakdown, is in the full report.

·  ·  ·

What this means

01

For buyers

The choice available has narrowed slightly and the prices have not. Fraser Valley inventory is down 6.3% year-over-year while its benchmark is down 7%, so the trade for waiting has shifted a little. Greater Vancouver has not moved the same way: sales there are still falling faster than inventory. The financing constraint is unchanged. The mortgage stress test still qualifies you at your contract rate plus two percentage points, or 5.25%, whichever is higher, and that qualifying rate does not fall because benchmarks have. Inventory is still well above its seasonal norm on both boards, so this is not urgency; it is a month where the direction of travel is worth watching rather than simply noting.

02

For sellers

Fewer sellers are competing with you than at any point this year. Fraser Valley new listings are down 15% year-over-year and 12.2% year to date, and inventory has now fallen for two months running. Against that, prices fell again in every segment, and a correctly priced Fraser Valley home took about 45 days to sell, 37 for a townhome. Pricing to the current benchmark rather than last year's remains the decision that determines the outcome, and apartment owners should plan for the same 45-day timeline as detached sellers plus the steepest annual decline of the three, with that benchmark down 8.9%.

·  ·  ·

Featured guide

Lower Mainland Housing Cycles, 1980–Present

Open the guide →

·  ·  ·

What I'm watching

What actually moved

A turn has two halves. Sellers stop adding supply, and then, usually later, buyers come back. The first half is the one you can see early, and a single month of sales is noise against it. This is not noise.
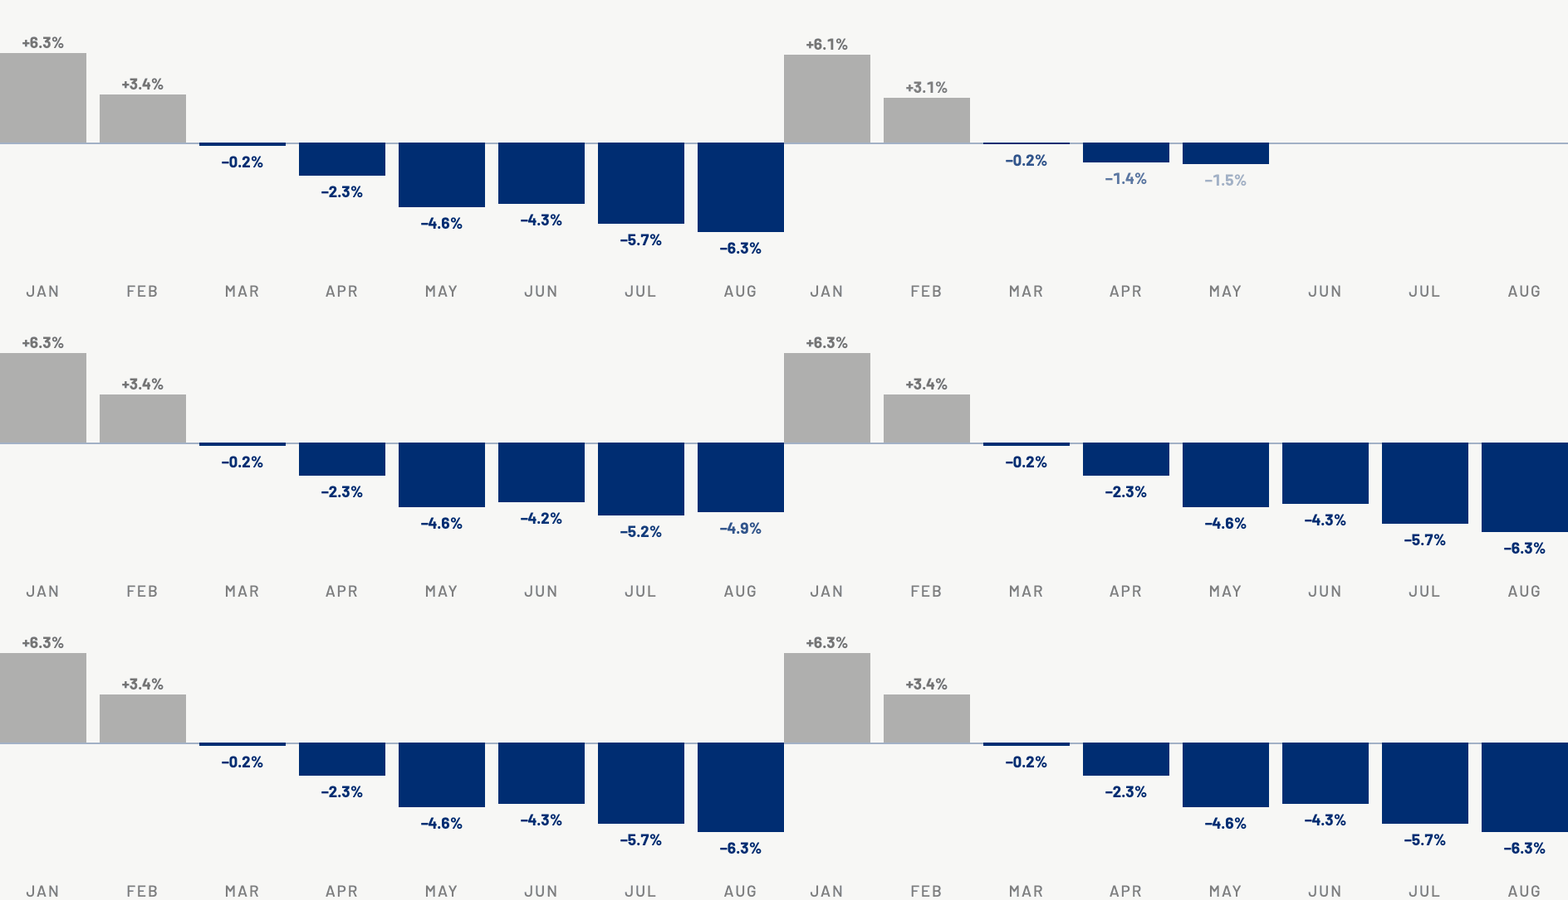
Fraser Valley active listings versus the same month a year earlier, 2026: January +6.3%, February +3.4%, March −0.2%, April −2.3%, May −4.6%, June −4.3%, July −5.7%, August −6.3%

Every month of 2026. Fraser Valley Real Estate Board, all property types.

In January there were 6.3% more homes for sale here than a year earlier. By August there were 6.3% fewer. Eight months, one direction, steepening rather than flattening. New listings are down 15% on the year.

That is the first half: sellers leaving faster than buyers. Sales are the second half, and they lag. They are still bumping along: 941 in August, 1.1% above last August, in a month when they fell 13.6% from July.

Two things I would want to know if I were reading this rather than writing it. That 1.1% covers all property types, and inside the three most people actually buy, sales did not rise: detached was exactly flat at 332 against 332, townhouses fell 2%, apartments 7.5%. And it is the second time this year, not the first. April was up 7.2% against falling inventory too, and it did not hold.

What is different is what sits behind it. In April inventory was down 2.3%; in August it is down 6.3%. Greater Vancouver is not doing this at all. Its inventory fell 2.7% while its sales fell 4.6%.

Everyone fell. Not everyone is still falling.
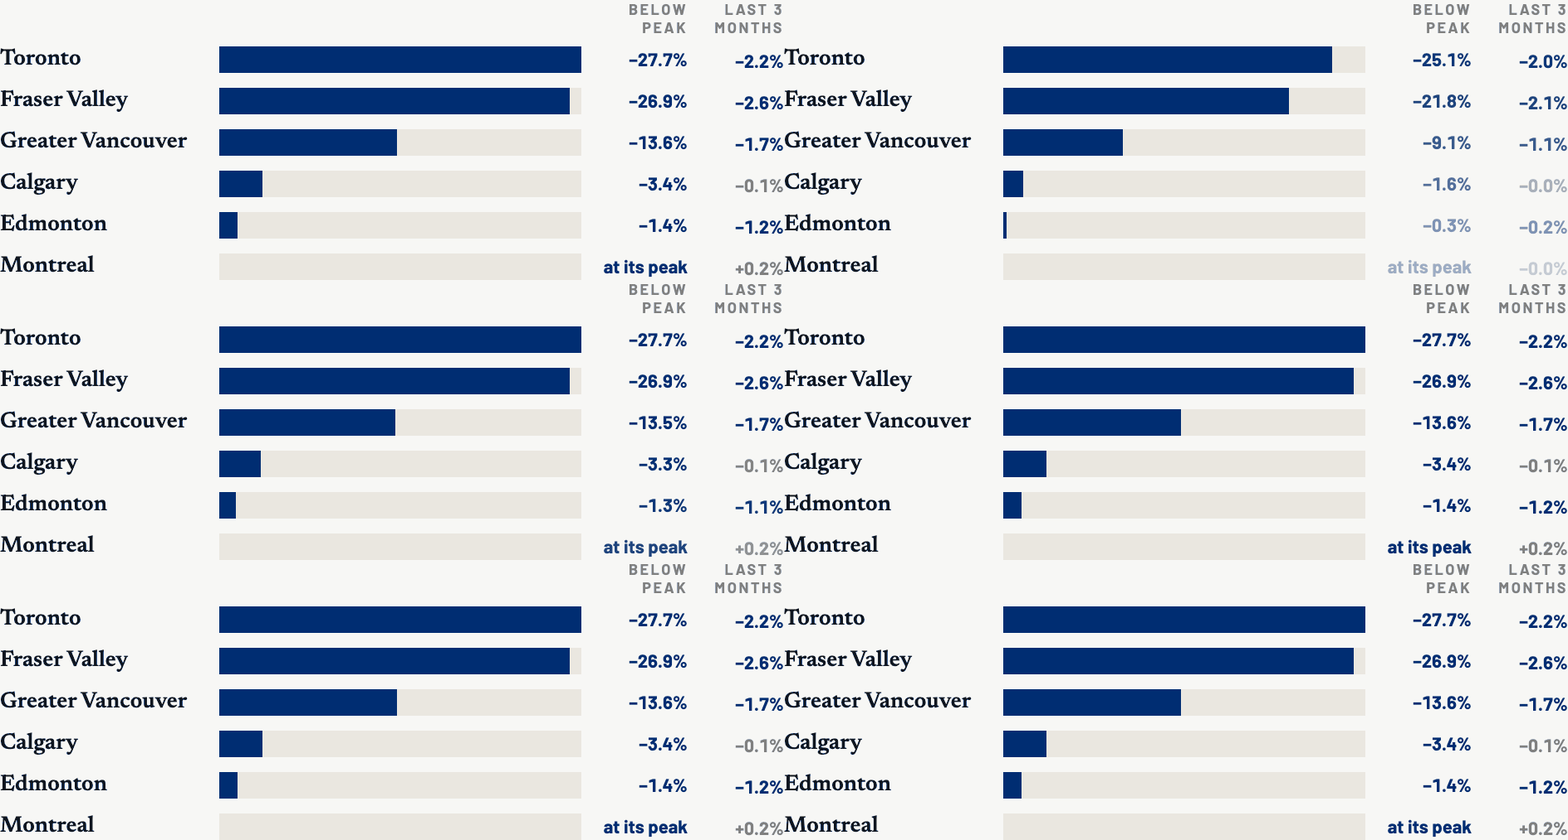
Below its own peak, then the last three months. Toronto −27.7% and −2.2%. Fraser Valley −26.9% and −2.6%. Greater Vancouver −13.6% and −1.7%. Calgary −3.4% and −0.1%. Edmonton −1.4% and −1.2%. Montreal at its peak and +0.2%

The bar is how far below its own peak each market sits. The figure on the right is its last three published months, which is August everywhere except Montreal, where it runs to June.

Calgary and Edmonton barely corrected at all; both are within a few per cent of their all-time highs. Montreal is at its record high on its latest reading, while we sit a quarter below ours.

Then there is Toronto, and Toronto is the one worth watching, because Toronto is us. It sits 27.7% below its 2022 peak and we sit 26.9% below ours. It has fallen slightly further than the Fraser Valley, and over the last three months it gave up 2.2% against our 2.6%.

That is not British Columbia being uniquely broken. On the national index, thirteen markets have fallen further from their peaks than the Fraser Valley has, and every single one of them is in southern Ontario. The deep falls happened in two places: there, and here. Both are the places that ran furthest in 2021.

And Toronto is doing what we are doing, harder. Its active listings are down 11.3% from a year ago and its new listings down 14.1%, against our 6.3% and 15%. Sellers are backing out of both deep markets at the same time.

The difference is which half has turned. Our sales rose 1.1% in August. Toronto's fell 2.1%.

What a bottom actually looks like

Vancouver Island is the nearest thing we have to a rehearsal: same province, same rates, same rules. It fell 15% from its April 2022 peak and bottomed in January 2023.
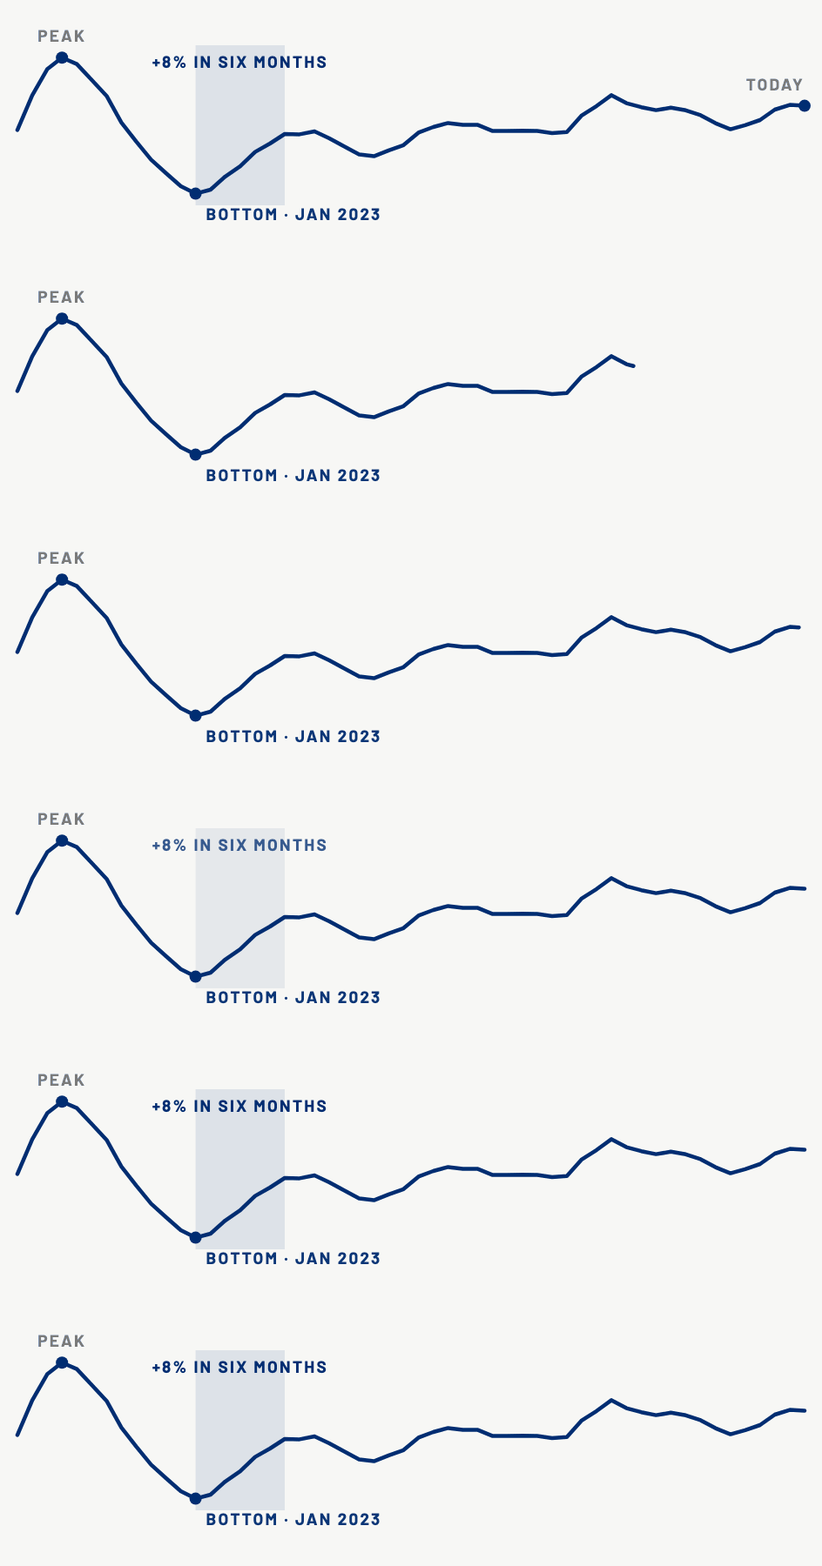
Vancouver Island composite benchmark: $744,600 at the April 2022 peak, $629,900 at the January 2023 bottom, $680,200 six months after it, $703,900 in June 2026

CREA MLS® Home Price Index, Vancouver Island Real Estate Board area.

Nothing marked that month at the time. No announcement, no headline, no moment when it became clear. It only became the bottom in hindsight, once enough months had passed for the shape to show.

Six months later prices were 8% higher. On a $630,000 home that is $50,300, and it went to the people who were already looking.

It is 11.7% above that low now and still 5.5% under the old peak, so this is not a story about prices rocketing. It is a story about the cheapest month being invisible while you are standing in it.

Ours would be a longer climb than theirs. A 27% fall takes a 37% gain to undo, and Greater Vancouver's 14% takes nearly 16%. The BC Real Estate Association has prices still easing this year before sales rise 7.7% in 2027, and their chief economist calls that recovery "slow and gradual".

Slow and gradual is fine. It is the months before it that reward paying attention, and that is the whole reason I send you the boring numbers every month.

Get ready, not busy

A word on who this is for. If you own a home and will buy another, the market mostly cancels out, because you sell into the same conditions you buy in. If you are buying your first home, or buying to invest, it does not cancel out. A market like this one is when your entry price gets decided, and that is who the rest of this letter is written for.

Three things, all free, none of which involve talking to me.

Know your number. The stress test guide explains the rule and the mortgage calculator does the arithmetic. Set a saved search for the type and area you would actually buy, and let it email you when something lands. And compare properly: the spreadsheet view puts price per square foot, strata cost per foot and days on market side by side, so the outliers surface in one sort.

And one thing that did not exist last year

For the past year I have been building a machine. Not a search and not a spreadsheet. A super intelligent machine that reads every home for sale in the Lower Mainland and prices each one against rents that were actually signed, with real fees, real taxes and the real cost of buying and selling. It sets aside what it cannot price honestly, ranks the rest, and brings the cream to the top. Right now the cream is thin, and I would rather hand you a short list I trust than a long one I do not.

It is the first tool of its kind here, built for people buying to invest, and I am opening it to a small first group.

Put me on the list
·  ·  ·

A few I’m currently representing

21980 100 AvenueFor sale$2,976,000Fort Langley
4 bed · 5 bath · 7,549 sqft
View listing →
403 – 1551 Foster StreetFor sale$735,000White Rock
2 bed · 2 bath · 1,246 sqft
View listing →
301 – 31158 Westridge PlaceFor sale$489,000Abbotsford West
2 bed · 2 bath · 862 sqft
View listing →

Browse all current listings →

·  ·  ·

Go deeper

Read the full August report
Market Insights Current listings
Recent sales Guides library
·  ·  ·

That is August. September's numbers land in early October, and I will tell you whether it held this time.

If anything here caught your attention, hit reply. I read everything that comes back.

Sincerely,

Bronson Job Bronson

Bronson Job PREC*, REALTOR®

Momentum Realty Inc.
216-20353 64 Avenue, Langley, BC V2Y 1N5
bronson@bronsonjob.com · 778-867-2766

*Personal Real Estate Corporation

View in browser · Subscribe (if forwarded) · Forward this to a friend

Momentum Realty Inc. · 216-20353 64 Avenue, Langley, BC V2Y 1N5 · Canada