|
What I'm watching
Half a turn, valley-wide
Last month I said a market turns in two halves.
Sellers pull back first. Then buyers come back.
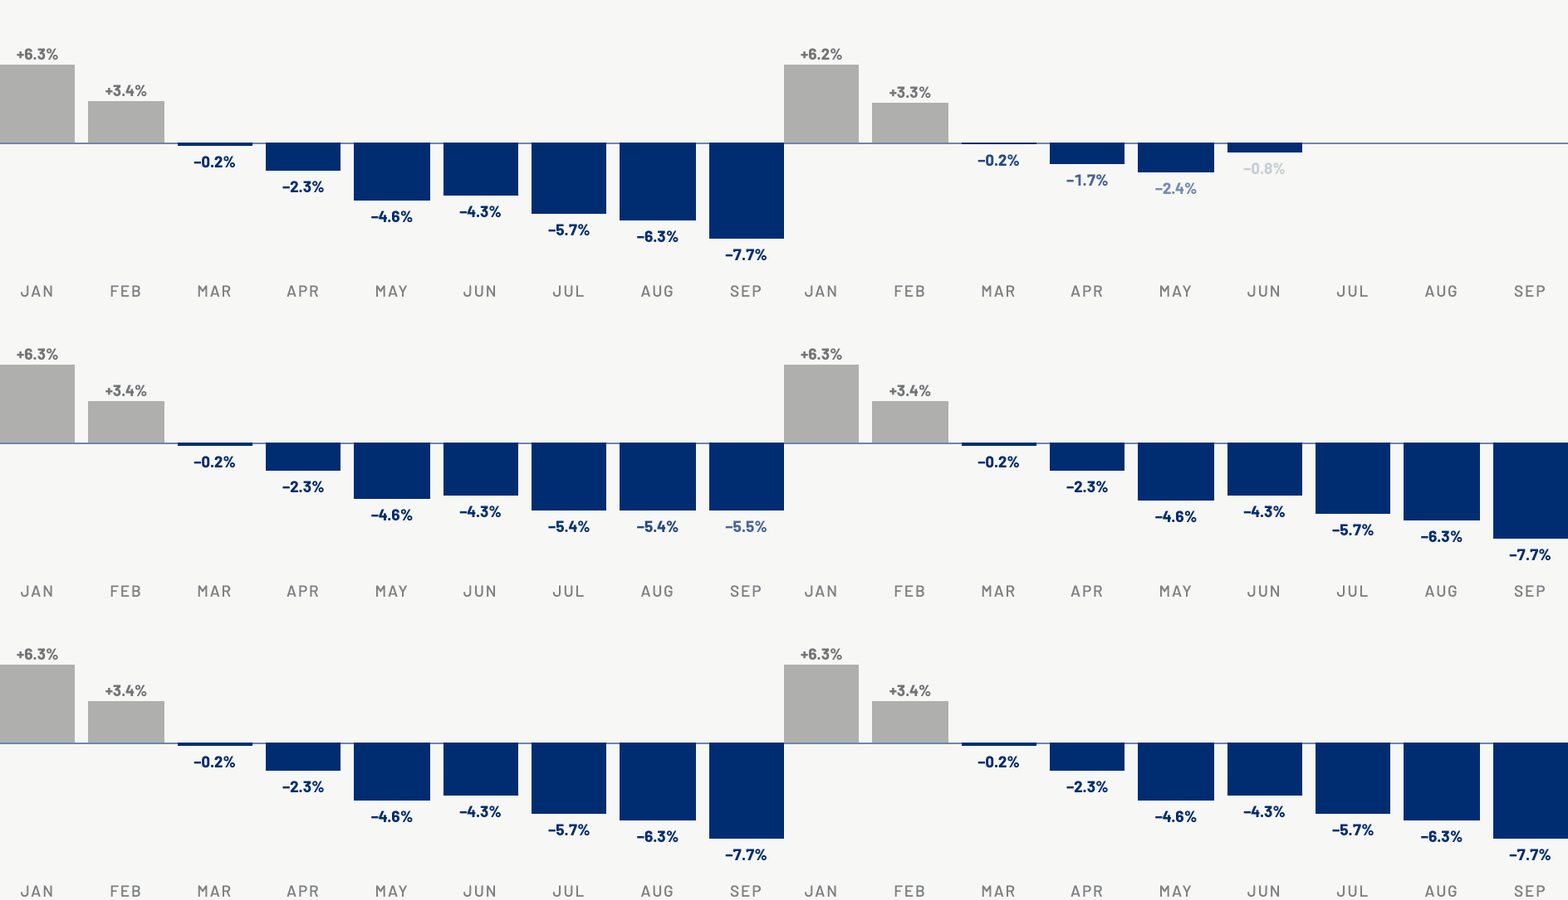
Homes for sale versus a year earlier,
every month of 2026. Fraser Valley Real
Estate Board, all property types.
|
The first half is well under way. Fraser Valley
listings were 7.7% below a year ago, the steepest
drop of 2026. The second half hasn't started.
Sales fell 4.2% in the Fraser Valley and 8.4% in
Greater Vancouver.
Except in Langley
Langley sales rose 4.1%, to 226. The rest of the
valley went the other way, and the gap is widest
for townhouses and condos.
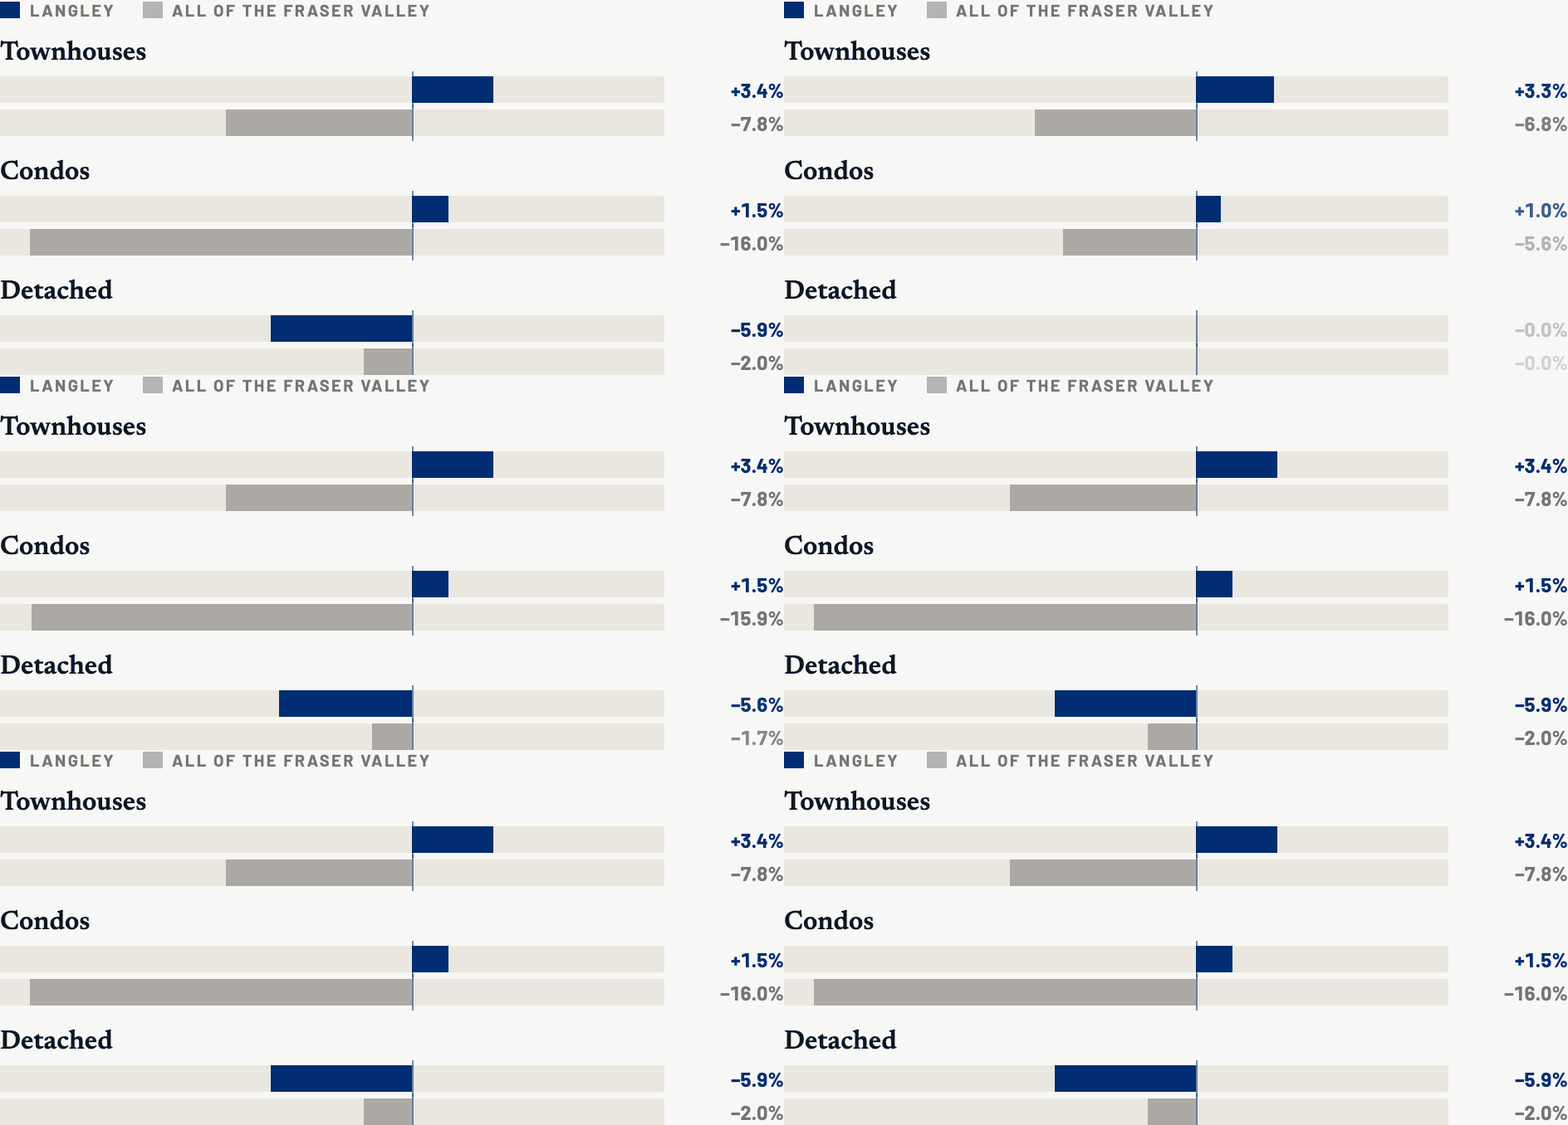
September sales versus a year earlier.
Fraser Valley Real Estate Board.
|
In Langley, both halves showed up at once. Buyers
came back, and sellers pulled back even harder:
Langley's condo listings fell 29% in a year.
Put together, Langley had about 16 sales in
September for every 100 homes for sale, counting
every home type. The board calls 12 to 20 a
balanced market, with neither side ahead. Every
other area it reports was between 8 and 12, which
favours buyers.
Langley's prices have also fallen the least:
down 9.6% from three years ago, the smallest drop
of any area the board reports.
The homes that sell, and the ones that sit
Price still matters. It just isn't the whole
story. I took every home listed for sale in
Langley, Surrey, Abbotsford, White Rock and
Mission from March to June, about 6,000, and
followed each one until it sold or came off the
market. Only about 3 in 10 sold. The rest were
withdrawn or expired, though some came back later
under a new listing.
The first three weeks decide most of
it.
Of the homes that sold, nearly half sold within 21
days of listing. They got about 98% of their first
asking price. The ones that took more than a month
got about 94%. A home that sits doesn't just
wait longer. It sells for less.
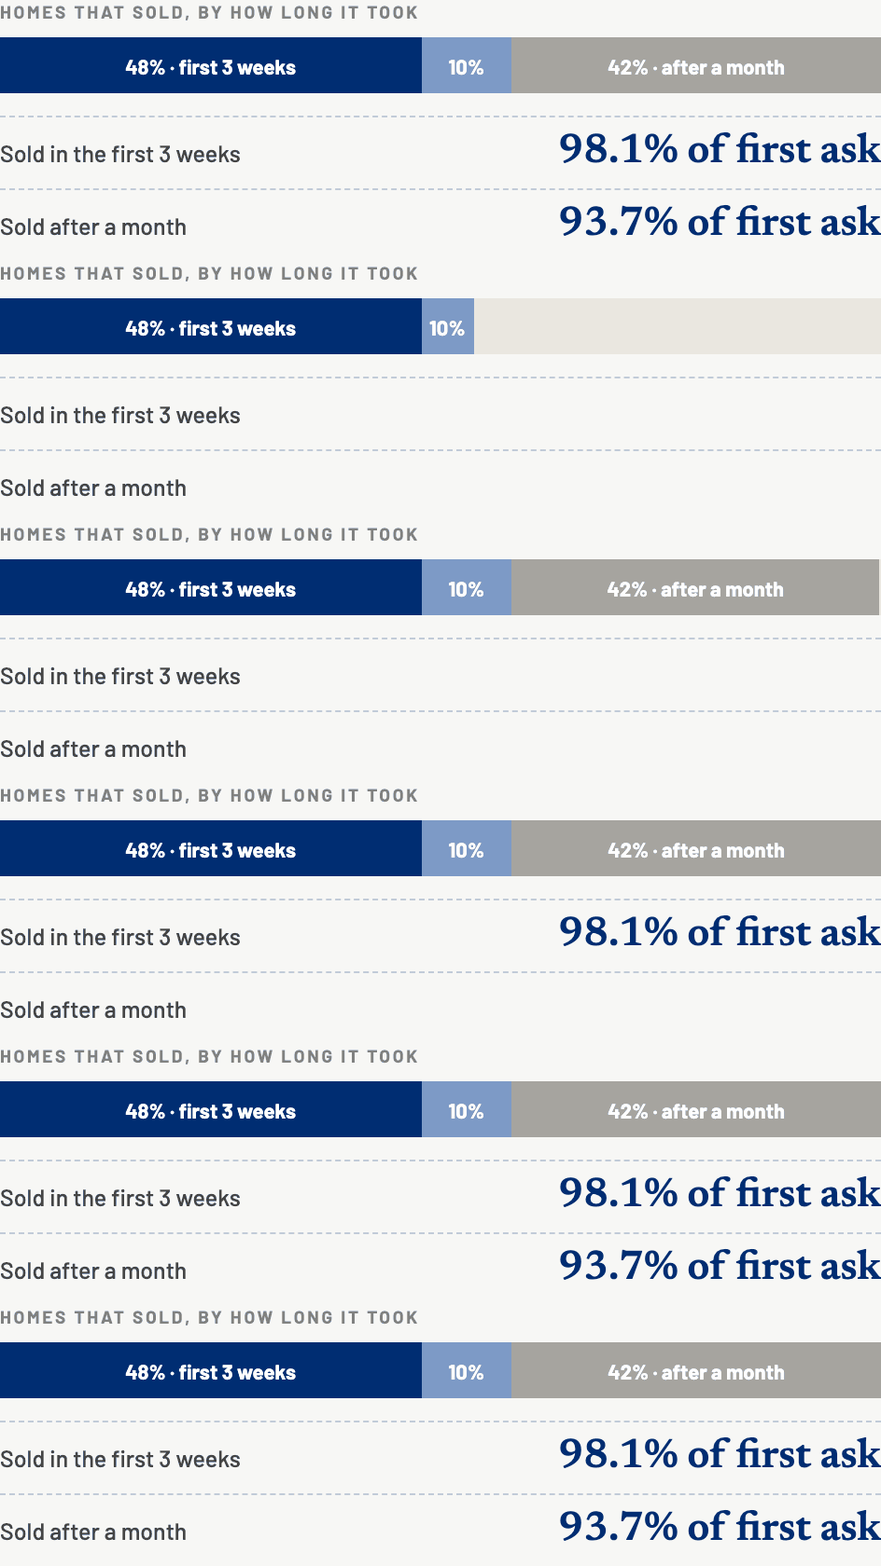
Homes listed March to June 2026 that sold.
The 10% in the middle sold between three
weeks and a month.
|
Condition changes the odds. I
sorted the listings by how they described
themselves. Detached homes described as updated
sold 33% of the time. Those that mentioned no
updates sold 27% of the time, so an updated home
was about a fifth more likely to sell. It also
sold faster: about 20 days instead of 25.
Fixer-uppers still sell, at a price.
Updated detached homes sold for about 96% of their
first asking price. Detached homes listed as-is
got about 92%. On a $1.5 million home, that gap is
about $60,000.
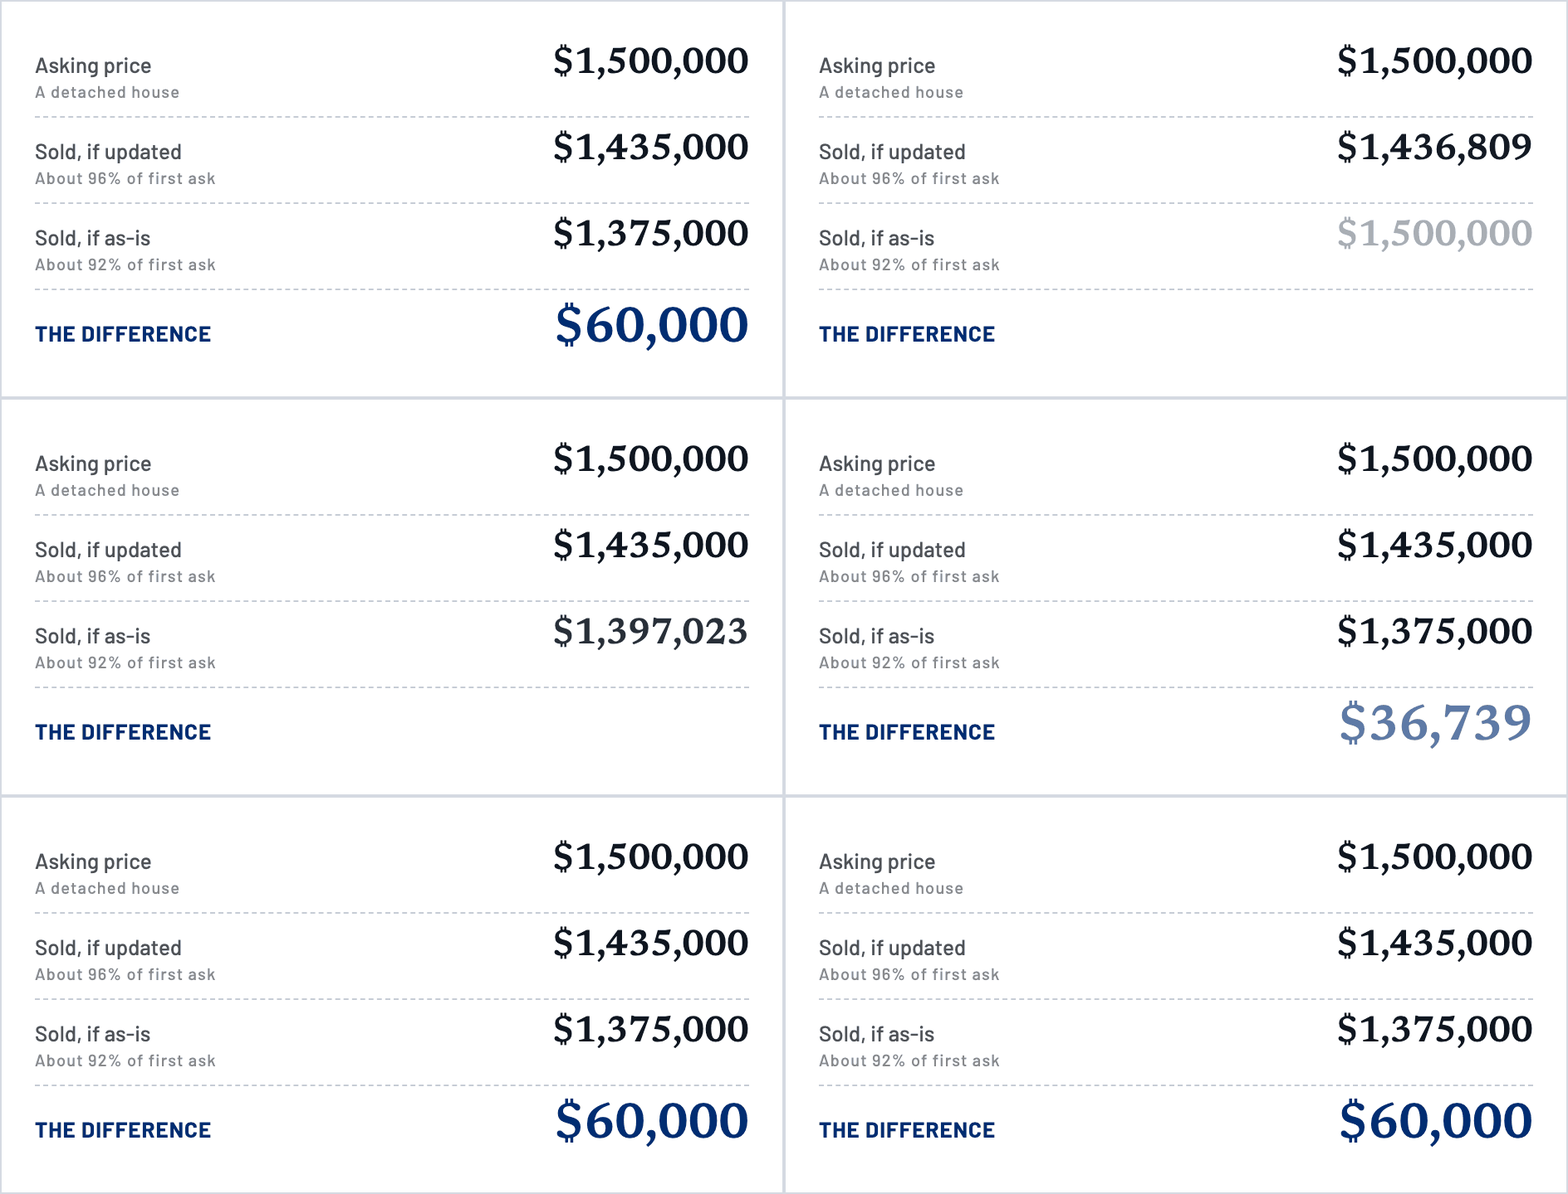
Detached homes, March to June 2026. Only a
few dozen sold as-is, so treat it as a
guide.
|
Location surprised me most.
Inside Langley alone, the share that sold ranged
from 57% of the homes listed in Walnut Grove to
34% in Brookswood. Same city, same months, same
mortgage rates. The neighbourhood moved the odds
more than condition did.
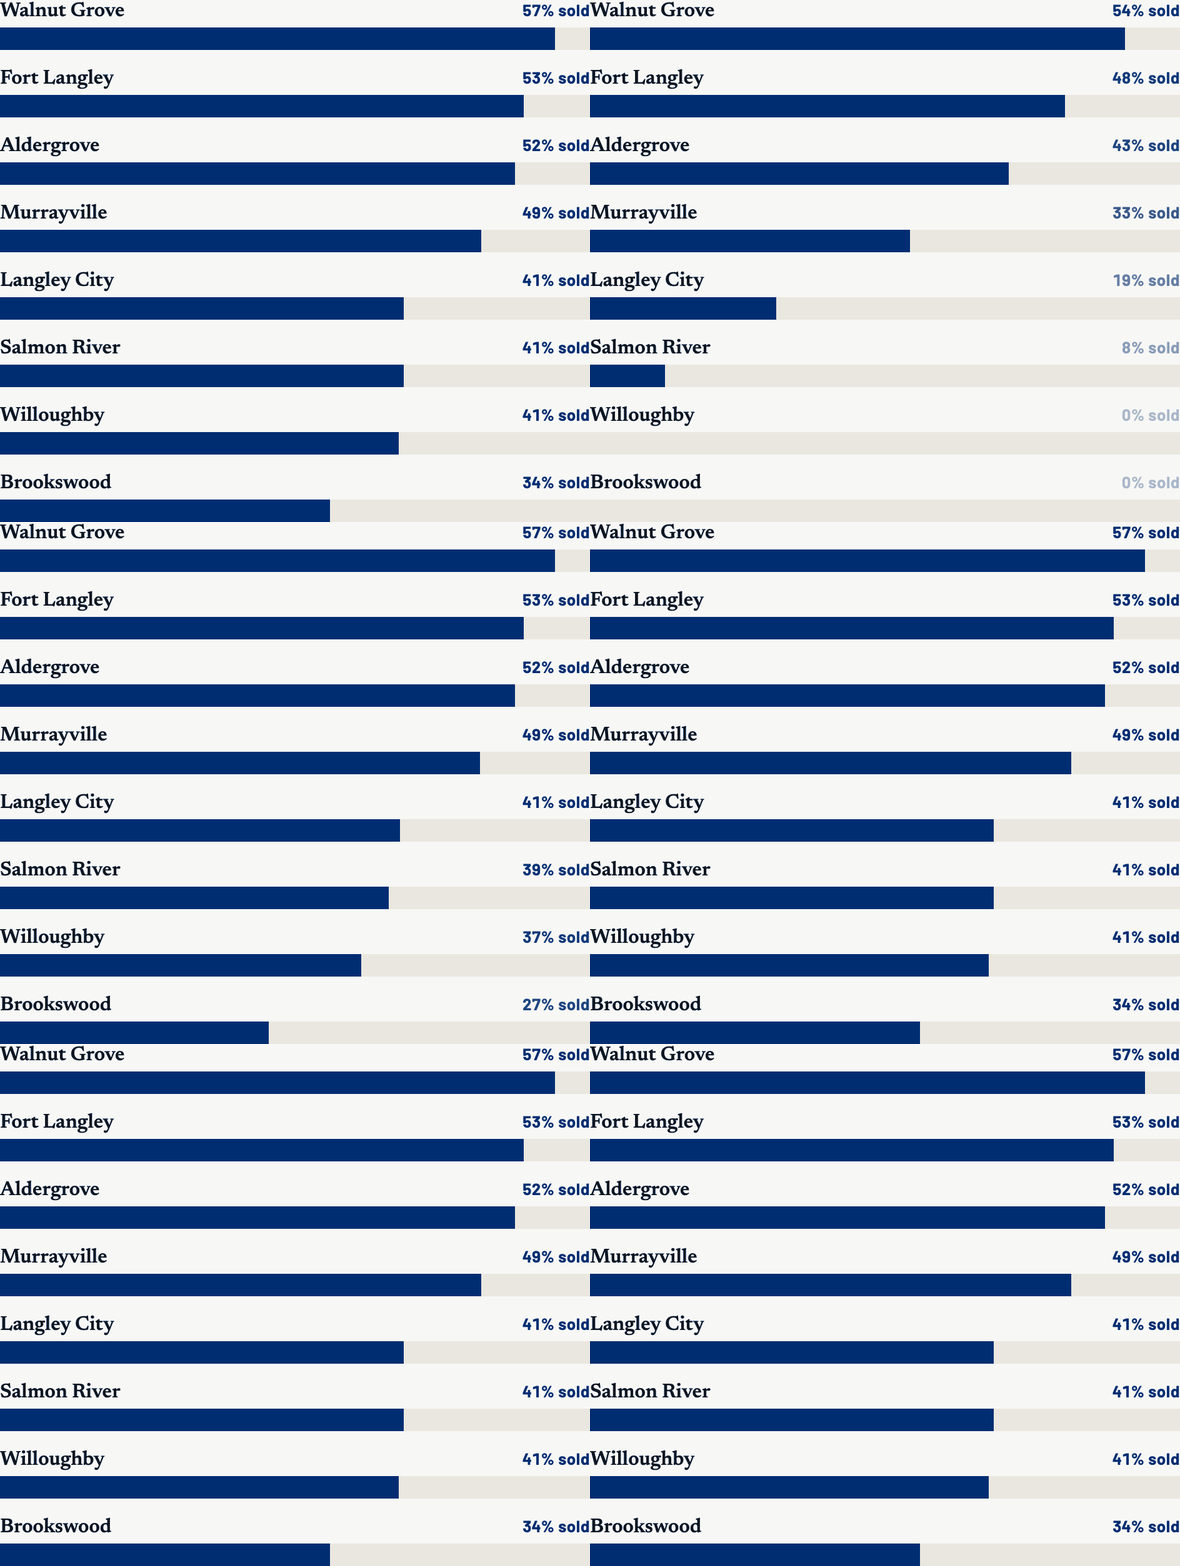
Langley neighbourhoods with 40 or more
listings. My count from MLS® listings.
|
Layout is the one the data can't see. I see
it at every showing. Buyers walk into a plan that
works and stay. They walk out of one that
doesn't.
"Updated" and "as-is" come
from what each listing said about itself, not an
inspection, so read this as a pattern rather than
proof. The lesson for sellers is plain. Do the
cleanup, the repairs and the photos before day
one, not after month one.
What hasn't turned
Prices. The typical Langley condo, by the
board's benchmark, is $525,900. That's
$53,400 less than a year ago, and it fell another
1.5% in September.
You'd expect that to make a condo cheaper to
own. It hasn't, because mortgage rates have
gone the other way.
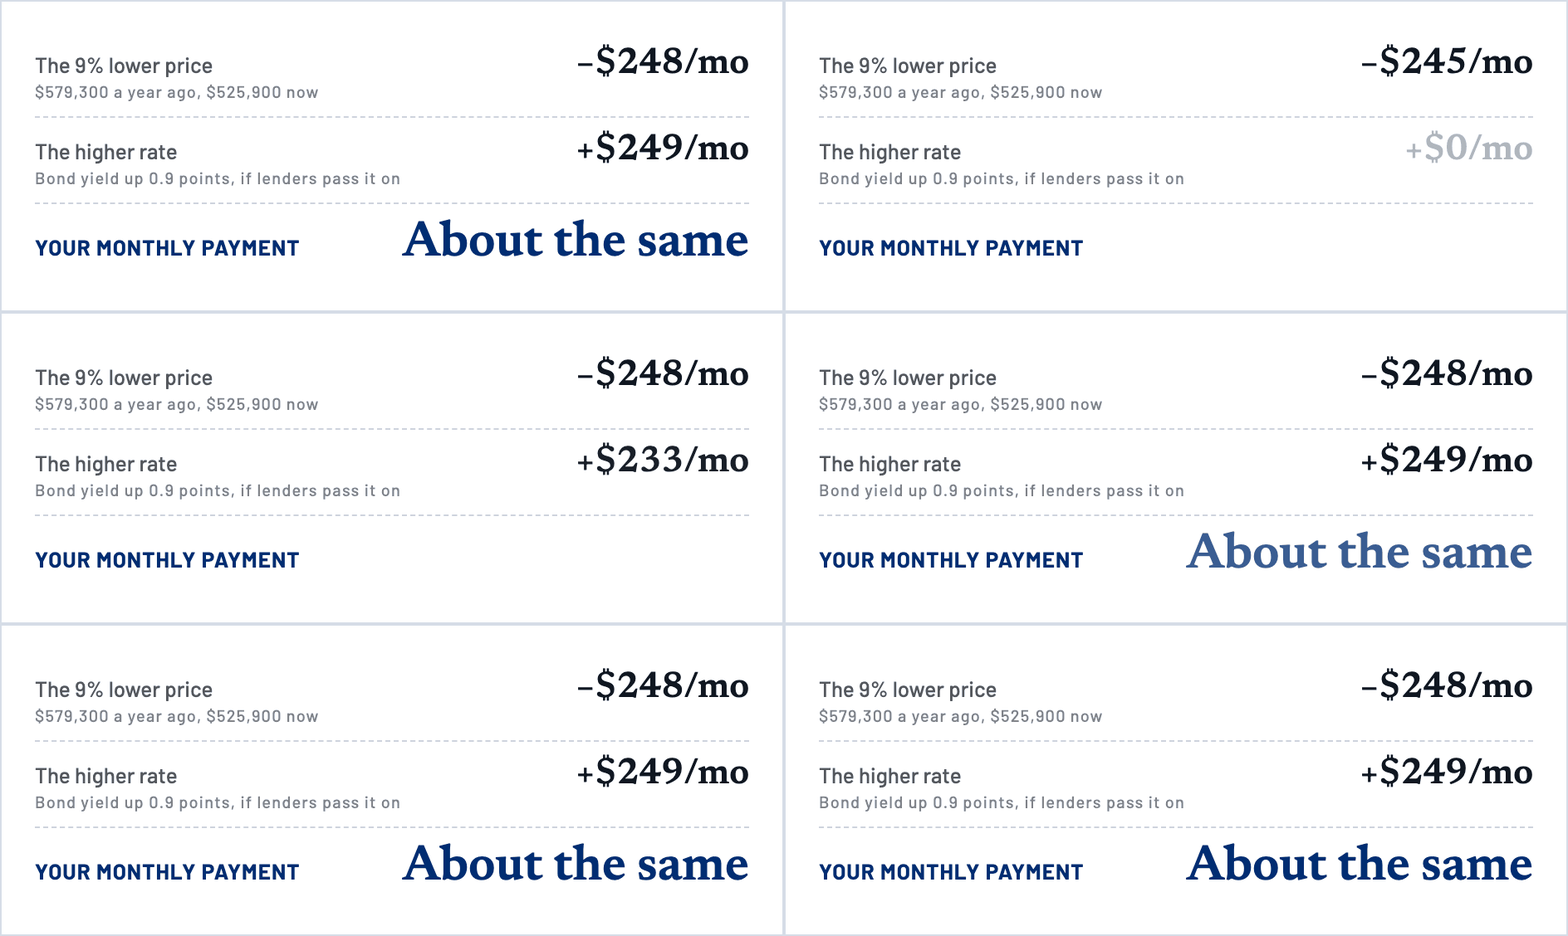
Typical Langley condo, minimum down
payment, insured 25-year mortgage. The
result holds at any starting mortgage rate
from 3% to 4.3%.
|
Five-year fixed mortgage rates follow the
five-year Government of Canada bond yield. That
yield is up nearly a full point since last
October. If lenders pass the rise on, the higher
rate adds about as much to the monthly payment as
the lower price saves.
Variable rates follow the Bank of Canada instead.
It announces its next decision on October 28.
So here's my read. For Langley townhouses and
condos, buyers and sellers are now on even terms.
Prices haven't turned, and neither has the
monthly cost. One month is not a trend. But if
you're buying, the well-kept homes have
competition again. If you're selling,
it's the first three weeks that count.
Two years of sales, on one map
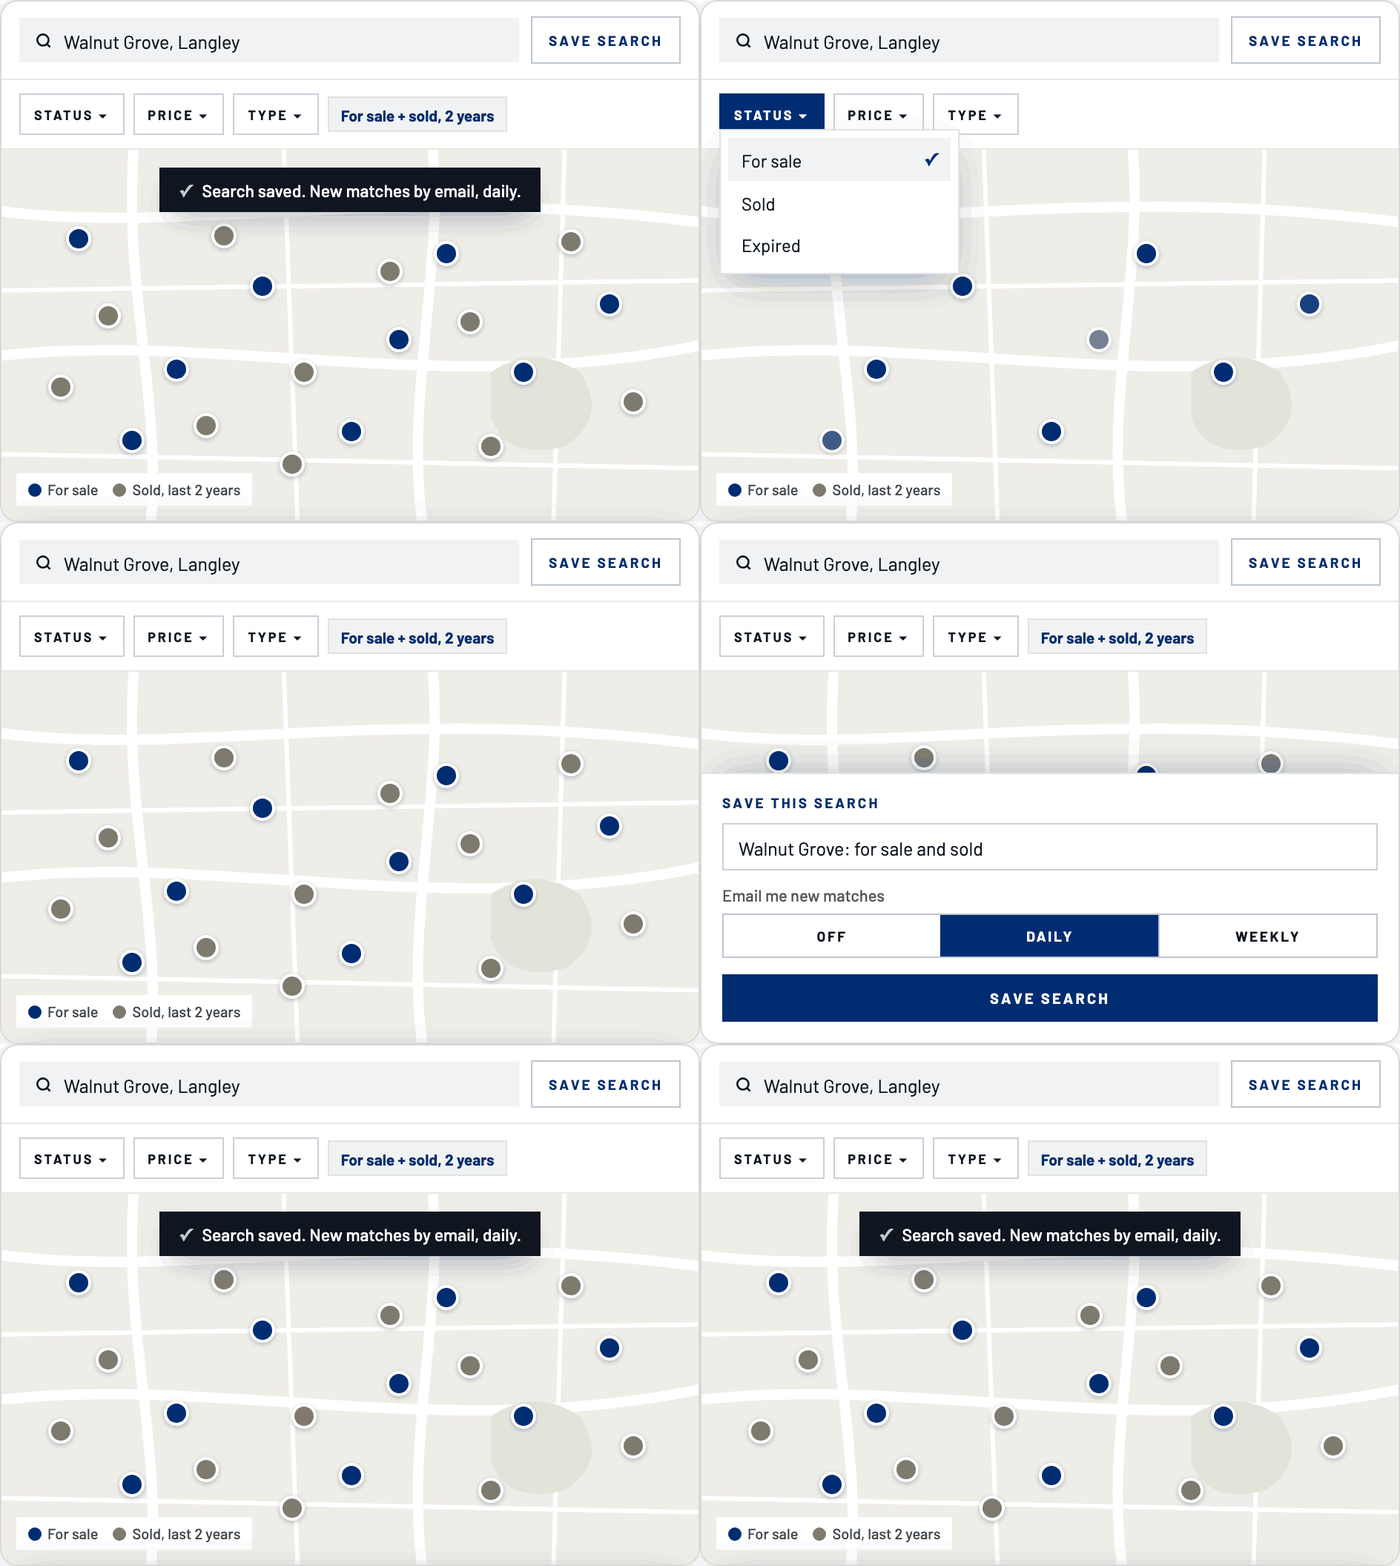
An illustration of the search, drawn in
the site's own design.
|
Google showed my website 79,765 times last month.
Fewer than 1 in 10 visitors sign in. Here's
what the rest are missing.
Two years of sold homes, each with its sale price
and date, on the same map as what's for sale
now. Search a neighbourhood, tap Sold, and the map
fills in. No app to download.
Then save the search. Pick for sale, sold or both,
and choose an email: daily or weekly. When a home
lists or sells in your search, you hear about it.
Sold prices show only to signed-in users.
That's the real estate board's rule, not
mine. The account is free, and you can sign up
with Google.
Or just reply with your neighbourhood and what
you're watching for, and I'll set the
search up for you.
Ask ChatGPT about the Township's candidates
Paste this link into ChatGPT or Claude:
bronsonjob.com/elections/langley-2026.md. Then ask
it what the Township of Langley candidates said
about whatever matters to you.
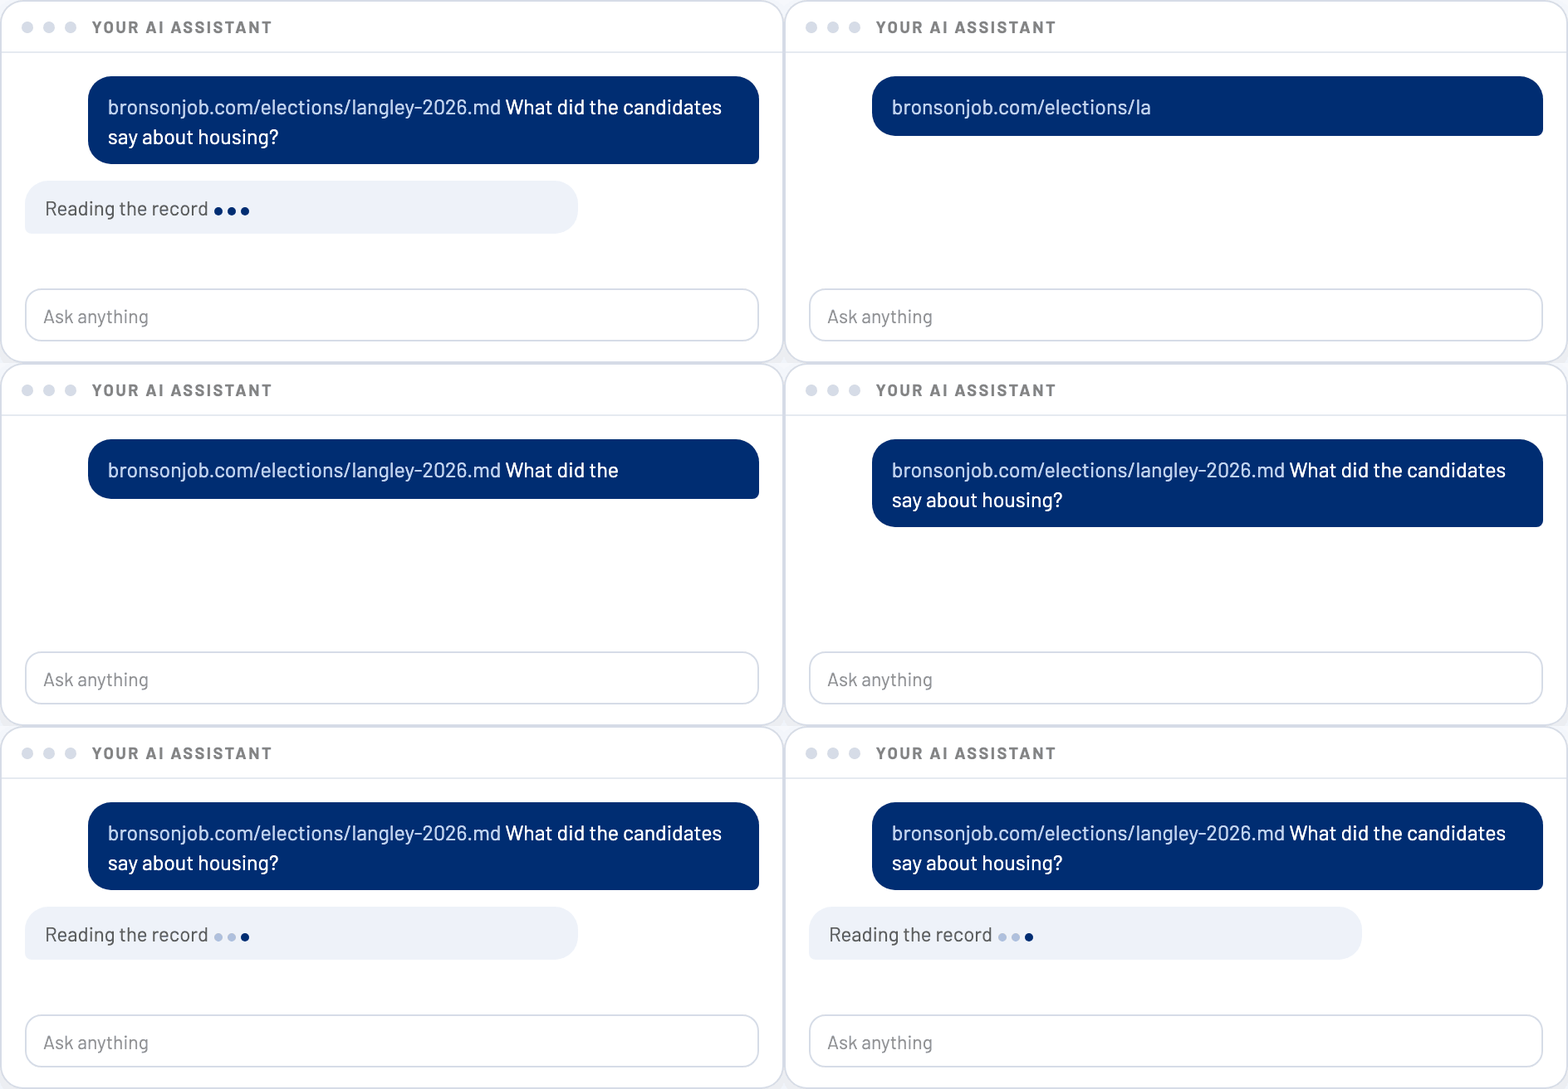
An illustration. Your assistant's
answer comes from the record, not from me.
|
The link is a plain-text copy of what the
candidates said at three all-candidates meetings
and one online Q&A, word for word.
Prefer to read it yourself?
The election page
has every answer, linked to its source.
Township advance voting runs October 6 to 10. In
the City of Langley it's at Timms Community
Centre on October 6, 7, 8 and 14. Voting day for
both is Saturday, October 17. The provincial
election follows on October 24, with advance
voting October 16 to 21.
Pancakes at 8
The 31st Cranberry Festival fills Fort Langley
this Saturday, October 10. The pancake breakfast
starts at 8, and
my guide
has where to park. Happy Thanksgiving.
|